AMD vs. Intel at 16 cores: We test Ryzen Threadripper 1950X against Core i9-7960X

 Image: Falcon Northwest
Who makes the best 16-core CPU? Now that AMD has its 16-core Ryzen Threadripper 1950X and Intel has its 16-core Core i9-7960X, we had a chance to find out when boutique custom PC builder Falcon Northwest built a pair of nearly-identical rigs that could truly go head to head.
Our 16-core Falcon Northwest Talon specs
As Falcon Northwest is famous for, both Talon systems are over-the-top in specs and chassis. Each came equipped with:
128GB of DDR4 RAMTwo Nvidia Titan Xp graphics cards in SLIA pair of Samsung 1TB 960 Pro SSDsA 6TB Western Digital hard drive
Both feature the same 1,000-watt EVGA Super Nova G3 PSU and the same custom closed-loop cooler system. The number and type of system fans are the same as well.
 Falcon Northwest
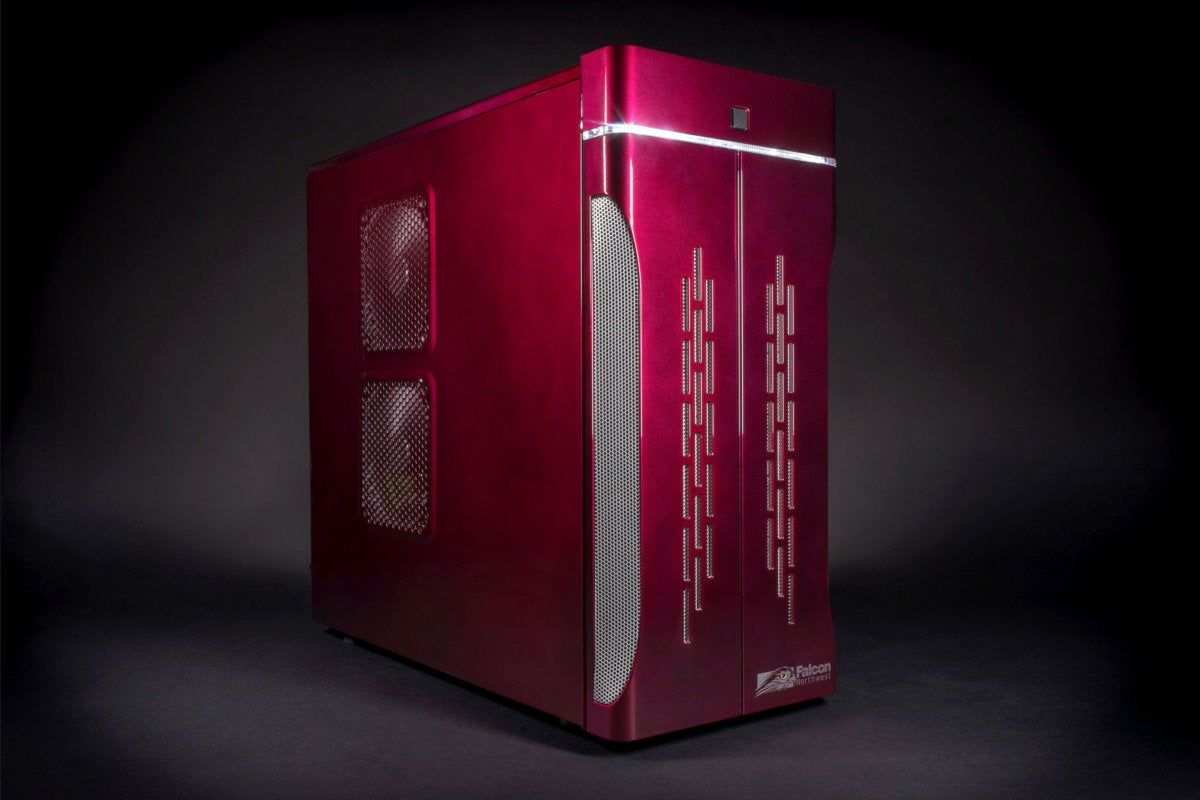
This Falcon Northwest Talon features a 16-core Threadripper 1950X, 128GB of RAM, and pair of Titan Xp graphics cards. The paint job is called Red Clouds.
Although both have the same storage subsystem, there is a slight variance. The pair of Samsung 960 Pro NVMe SSDs in the Intel system are configured as PCIe devices in RAID 0, while the AMD box keeps both Samsung 960 Pro drives as separate drives.
We settled for this variance so as not to hobble the Intel box. After all, at the time we requested the machines in early September, RAID 0 using NVMe drives was available only on the Intel platform (not VROC, but using the X299 chipset) not on AMD’s X399. Since then, AMD has introduced support for NVMe RAID.
Looking at the read and write performance of both machines, the difference doesn’t seem to matter much. The Intel system has somewhat higher read speeds, while the AMD system has somewhat higher write speeds.
We matched carefully in most other areas. Both CPUs are kept bone stock. At the time of our story, Falcon had qualified 128GB of RAM up to DDR4/3000 speeds for the Intel system, while the highest-clocked RAM on the Threadripper system when using 8 DIMMS was DDR4/2400. We decided to keep both machines at DDR4/2400 to match in price as well as capability.
Other than the CPU and motherboard, the only other big difference is the color.The AMD machine is hand-painted in luscious Red Clouds, while the Intel machine is hand-painted in the striking Cobalt Clouds.
 Falcon Northwest
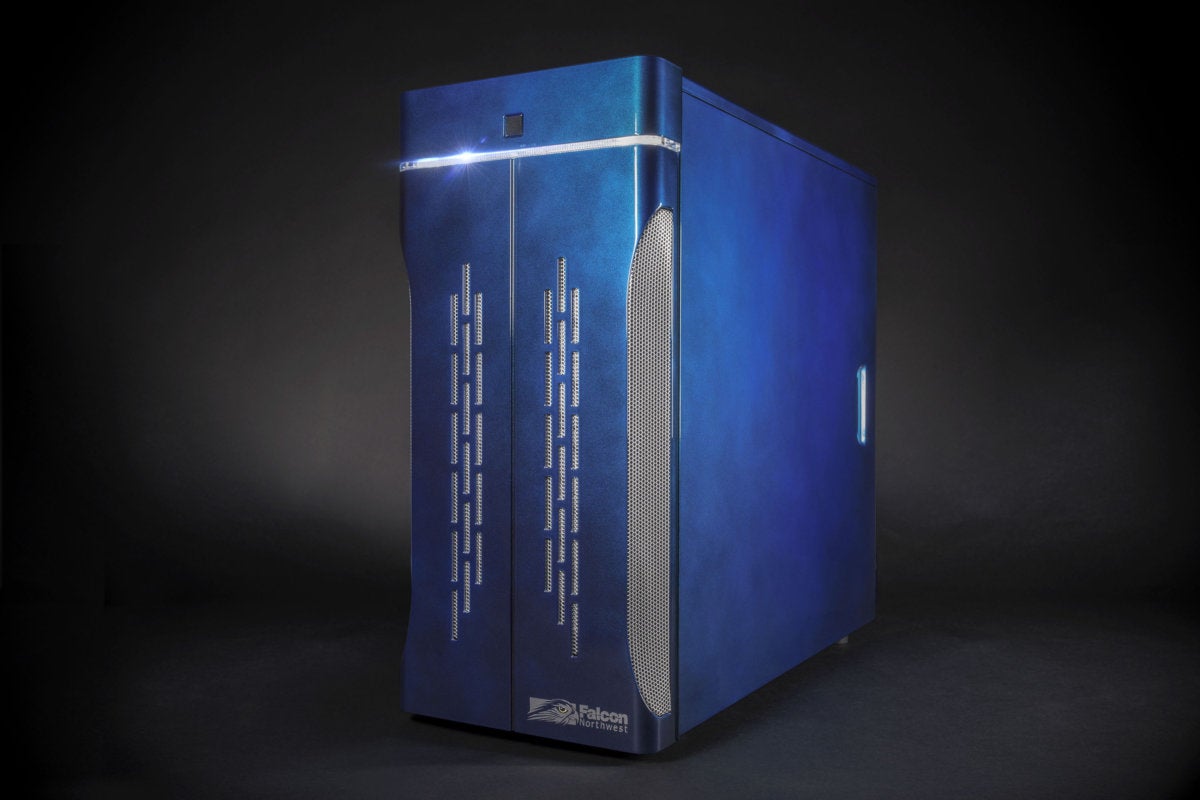
This Falcon Northwest Talon features a 16-core Core i9-7960X, 128GB of RAM, and a pair of Titan Xp graphics card. The paint job is called Cobalt Clouds.
Performance: CPU-centric tests
Cinebench R15 Performance
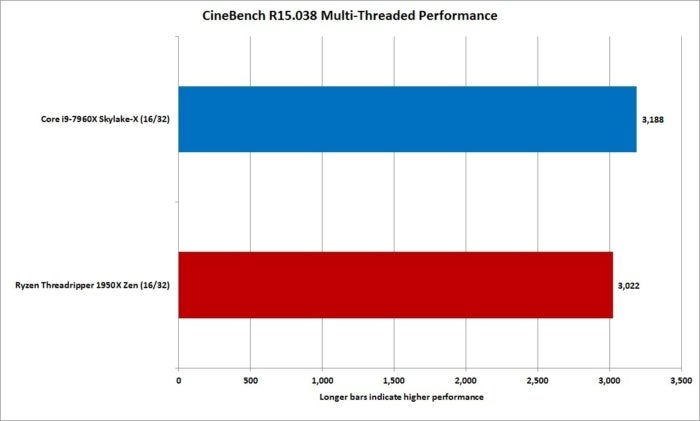
First up is Maxon’s Cinebench R15 test. It’s a free benchmark based on the rendering engine Maxon uses in its professional Cinema4D app. It’s highly multi-threaded and almost entirely a CPU-focused test (though there is a graphics test, too).
The default mode is to test all of the cores at once. The Core i9 squeaks by the Threadripper box by a few percentage points.
 IDG
IDGOur first test is CineBench R15, where the 16-core Core i9-7960X has a very small advantage.
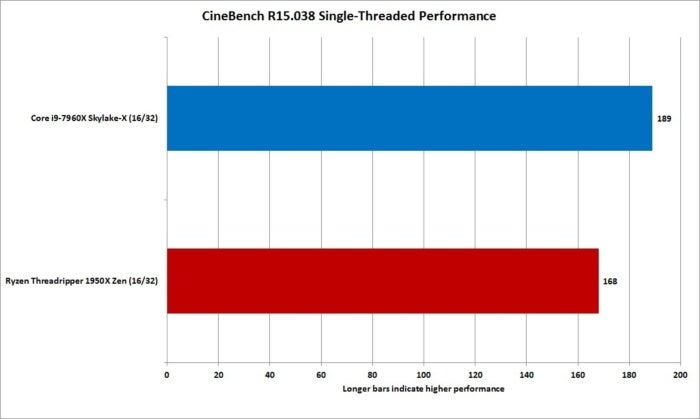
Cinebench R15 also allows you to tweak the number of threads to test, so we ran it on only a single core. This is where Intel has had an advantage over Zen-based chips, and it shows with the Core i9’s 15-percent lead on single-threaded tasks. We’ll dive into just where Intel gets this advantage later, but anyone who thinks this isn’t a big win for the 16-core Core i9 is in denial.
 IDG
IDGCinebench R15 on light loads gives the Intel chip the nod.
POV Ray Performance
The Persistence of Vision Raytracer is an app that literally goes back to the days of the Commodore Amiga. Obviously converted to run on modern hardware, the free ray tracer loves CPU cores and threads. As we saw with Cinebench, the Core i9 has a slight edge in performance.
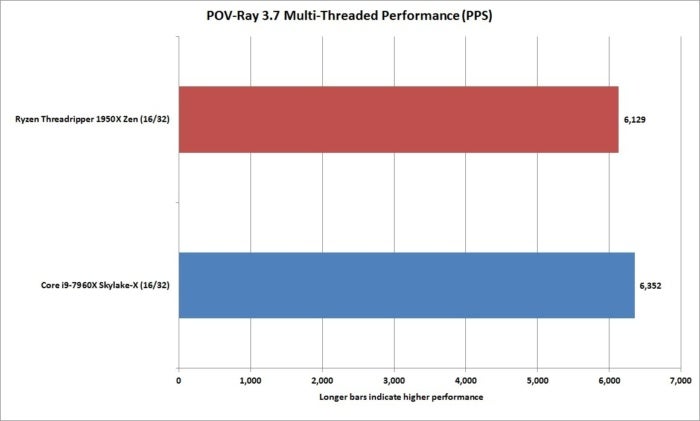 IDG
IDGcaption
POV-Ray also supports running in single-threaded mode. As with Cinebench, we see a very clear advantage go to the Core i9, mostly due to the clock speed advantage the Intel chip holds. (We’ll get into just how much of a clock speed advantage that is later on.) There’s no denying that on lightly threaded loads, Core i9 has the advantage.
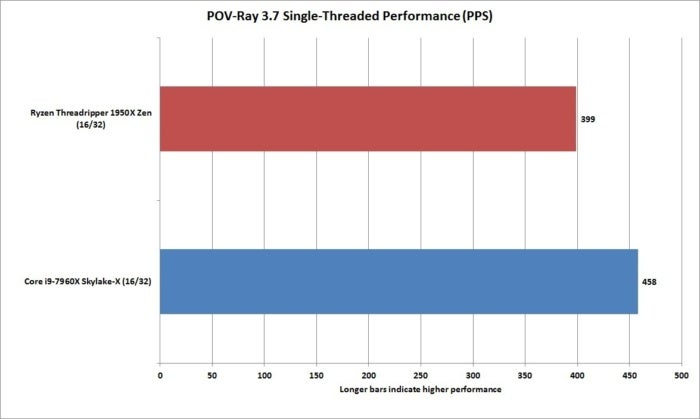 IDG
IDGcaption
Blender Performance
Blender is an open-source 3D modeler that sees a lot of use by independent movie makers for effects sequences. Even NASA uses Blender these days to produce 3D models.
Blender was also the benchmark of choice AMD used when it first unveiled its Zen CPU last year. So who leads the way here? In the chart below (showing Blender using the BMW benchmark), lower scores are better in rendering, and the Core i9 has a double-digit lead over the Threadripper part. Ouch.
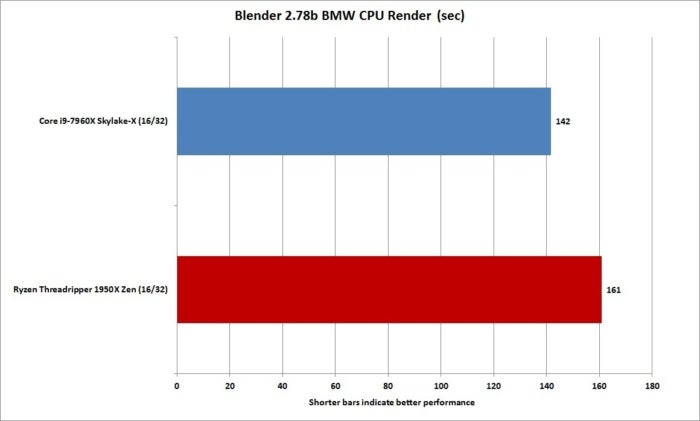 IDG
IDGUsing the popular BMW benchark load in Blender, The Core i9 has a small advantage over Threadripper.
Corona Renderer 1.3 Performance
Corona Renderer was first introduced with AMD’s Threadripper, and it was used to soundly trounce Intel’s 10-core Core i9-7900X chip because 16 > 10. When it’s 16-on-16, though, things go a little sideways. Where Cinebench and POV-Ray put the two CPUs fairly close, Corona Renderer 1.3 puts the Threadripper about 19 percent slower than the Core i9. Ouch again.
Benchmarks can be easily become political footballs, with one side’s fans claiming a test is cooked to favor the other. Let’s remind everyone that it was AMD who recommended the Corona Renderer test.
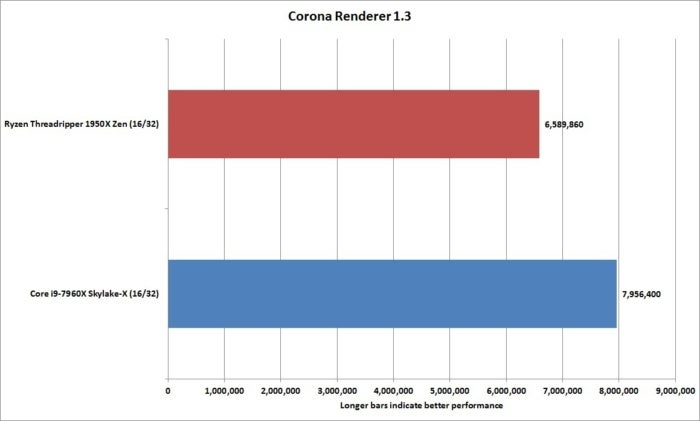 IDG
IDGAMD showcased the Corona Benchmark for the Threadripper launch, but in a matched 16-core vs. 16-core battle, the Ryzen loses.
7-Zip Performance
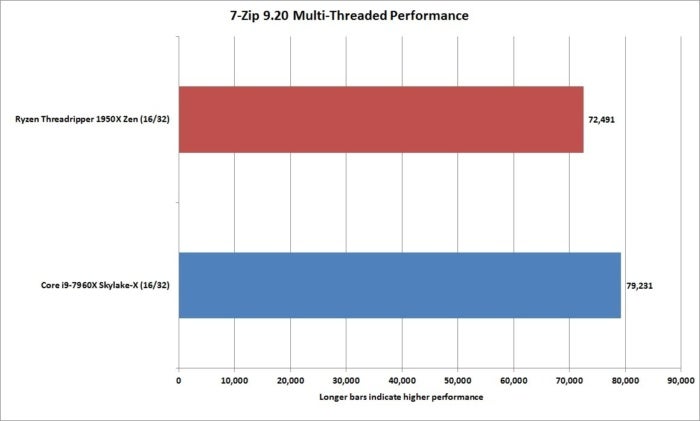
Moving on to a compression test, we use the popular and free 7-Zip to measure how fast each machine is at handling file compression. Using the internal benchmark, the Core i9 is about 9 percent faster.
 IDG
IDG7-Zip on multi-threaded tests has both CPUs fairly close in performance.
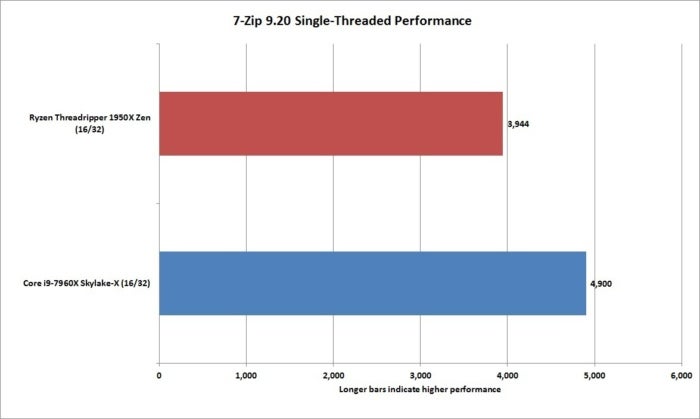
7-Zip also features a single-threaded test, the results of which are no surprise: The Core i9 comes out about 21 percent faster than the Threadripper part. Again, this is likely due to the clock speed advantage of the Intel chip over its AMD counterpart.
 IDG
IDGIn single-threaded tasks, the advantage Core i9 has over Threadripper is much clearer.
Handbrake Performance
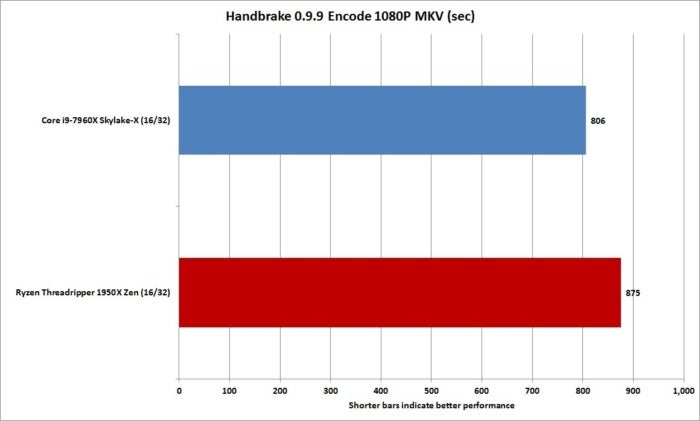
For encoding, we ran our standard test, which tasks the free Handbrake encoder with converting a 30GB 1080p MKV file using the Android Tablet preset. Like most encoders, Handbrake favors having more cores, and we see the two chips in the same neighborhood at least. The Core i9 still comes out ahead by 8 percent, but at least it isn’t the blowout we saw in Corona or Blender.
 IDG
IDGFor our encoding test, we tasked each machine with converting a 30GB 1080p MKV file using Handbrake.
Yes, yes, but how do they game? Keep reading to find out.
Gaming Performance
We don’t typically consider a 16-core Core i9 or 16-core Threadripper chip as CPUs for gamers, but in reality, a lot of people with high-end hardware play games. Given that both rigs are configured with a pair of Titan Xp cards, we simply have to test these machines in gaming.
Note that we ran the Threadripper using the latest version of Ryzen Master in Game Mode and in Creator Mode (which you can read about here in our original review of Threadripper.) The best score for each test was reported.
3DMark Time Spy 1.0 Performance
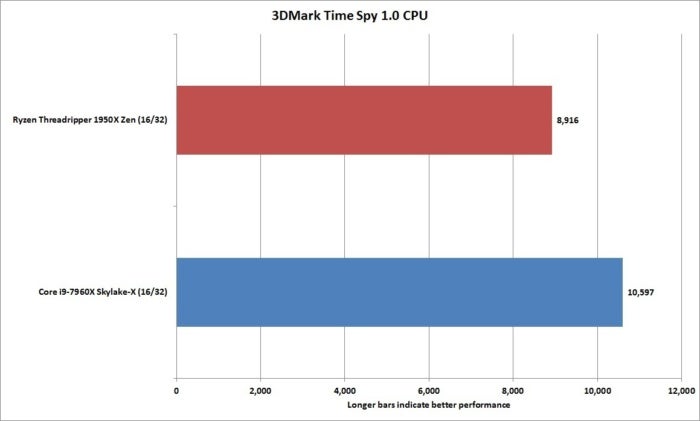
First up is Futuremark’s 3DMark Time Spy test. It’s the company’s latest DirectX12 benchmark. Because we care only about CPU performance, we’re reporting only the CPU subscore. Cleary, the test likes Core i9 more.
 IDG
IDG3DMark Time Spy also gives the nod to Intel.
3DMark Time Spy Extreme 1.1 Performance
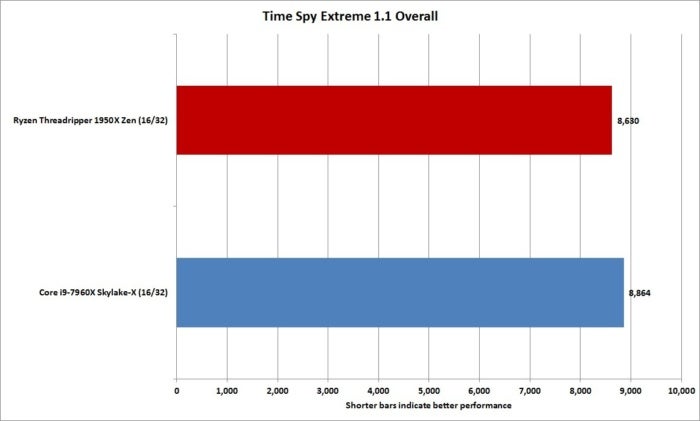
Futuremark has been hard at work creating an Extreme version of its new DirectX12 benchmark. Luckily, we had it in time to run on our pair of Falcon PCs.
 IDG
IDGHere’s how nearly identical PCs perform in the brand new 3DMark Time Spy Extreme 1.1.
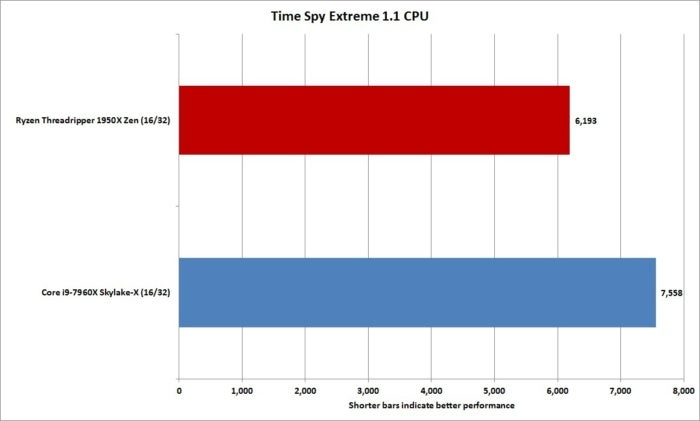
The overall score itself was basically a tie, with the Core i9 box hitting 8,864 and the Threadripper box scoring 8,630. If you dig into the sub-score focusing on the CPU, though, the Core i9 again has a performance edge by about 20 percent. Why? That’s hard to say. It’s unlikely this is all a clock speed advantage.
 IDG
IDGThe newly released 3DMark Time Spy Extreme 1.1 favors Intel in its CPU test.
Middle-earth: Shadow of Mordor Performance
The next step is to see how this translates into real games at real resolutions. We ran several off-the-shelf games on their highest visual quality settings at 4K resolution. There’s no 1920×1080 at Medium nonsense here: It’s all about playing with the pair of Titan Xp cards maxed out.
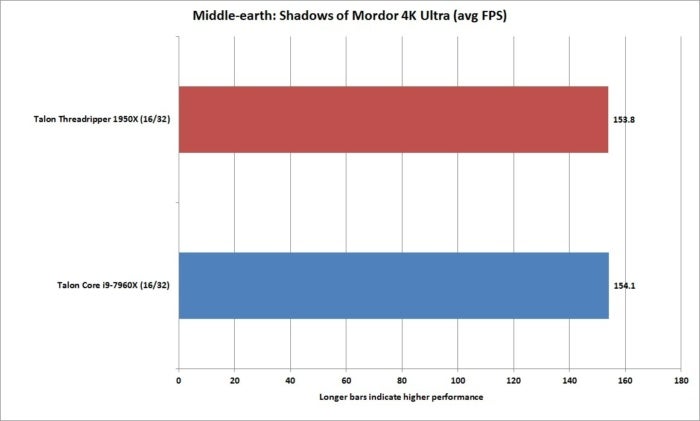
As we noted previously, we ran the tests in both Game Mode and Creator Mode on the Threadripper system, and we used the highest score obtained in either mode. For Middle-earth: Shadow of Mordor, though, it didn’t matter. Both of Threadripper’s modes produced the same performance. And yes, for the most part, even with a pair of Titan Xp cards in SLI, both Falcon machines are tied.
 IDG
IDGBoth machines are pretty much tied in Middle-earth: Shadow of Mordor run at 4K resolution on the Ultra quality setting.
Rise of the Tomb Raider Performance
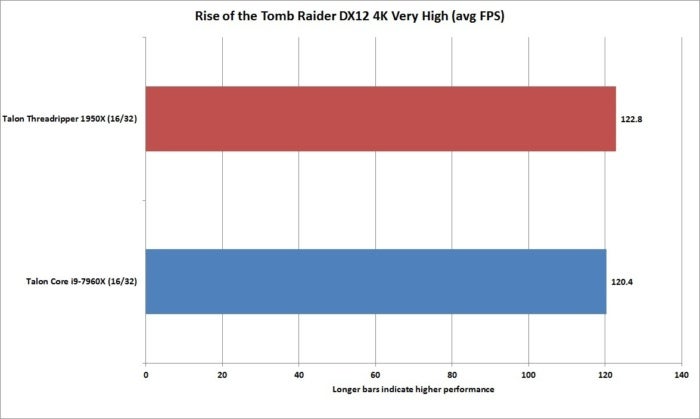
Our next test was Rise of the Tomb Raider. AMD made much hay of Rise of the Tomb Raider’s patch, which helped close Ryzen’s performance gap compared to Intel chips. The problem, AMD said, was old code that just didn’t know how to deal with Threadripper. For our tests, we ran at 4K resolution on the Very High preset and in DirectX 12 mode. Threadripper is a frame or so faster, but for most part—it’s a tie.
 IDG
IDGIn Rise of the Tomb Raider, a much-ballyhooed patch puts Ryzen Threadripper right in step with Core i9.
Deus Ex: Mankind Divided Performance
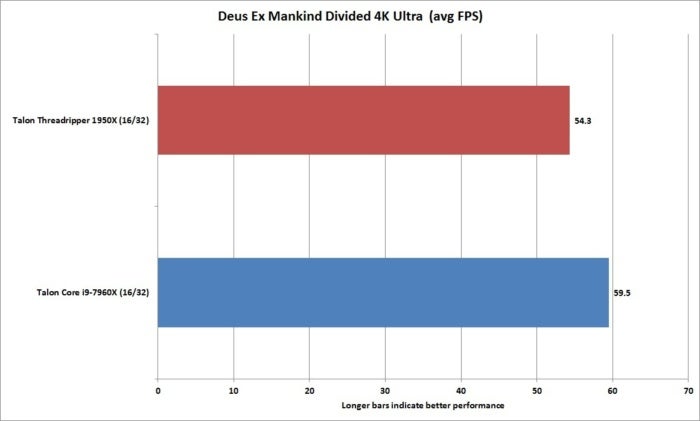
Deus Ex: Mankind Divided is another test that AMD really loved when Ryzen 7 first shipped because, well, it runs pretty well on AMD CPUs. For our test, we ran Mankind Divided on the Ultra setting and 4K resolution.
The result from a gaming perspective is disappointing, as both machines could barely reach 60 fps even with two Titan Xp GPUs and high-end CPUs. More importantly, the Core i9 has a slight edge in frame rate. The performance of Threadripper was the same between Game Mode and Creator Mode.
 IDG
IDGCore i9 has a slight edge in Deus Ex Mankind Divided.
Tom Clancy’s Rainbow Six Siege Performance
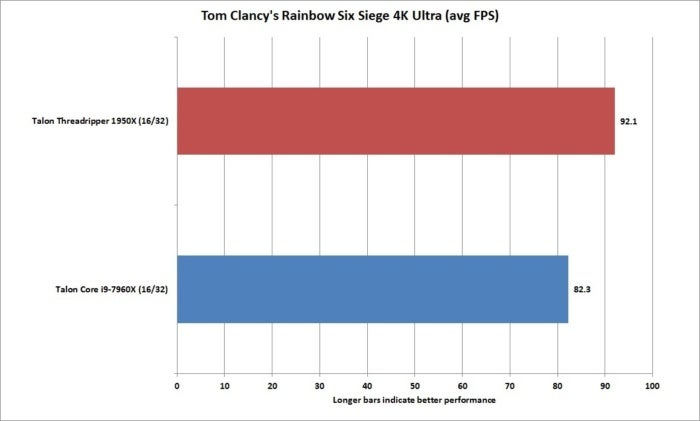
So far the balance in gaming has been a tie or in favor of Intel, but that flips once we get to Tom Clancy’s Rainbow Six Siege, which we ran at 4K resolution and on the Ultra quality setting. The Threadripper Talon system comes out on top by a very decent amount. Its score was achieved with it set to Game Mode, but when set to Creator Mode, it wasn’t that far off.
 IDG
IDGIn one of the rarer wins for Threadripper, it comes out a solid 10 fps faster than the Core i9 machine.
Ashes of the Singularity: Escalation performance
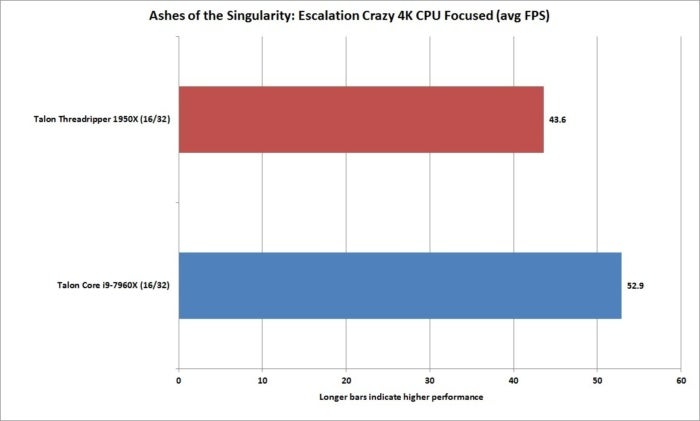
Our last gaming test is Stardock’s Ashes of the Singularity: Escalation. We ran the test at 4K using the Crazy preset and the CPU Focused setting to test the CPU, rather than in the GPU Focused mode.
 IDG
IDGAshes of the Singularity: Escalation appears to favor Intel.
Power consumption
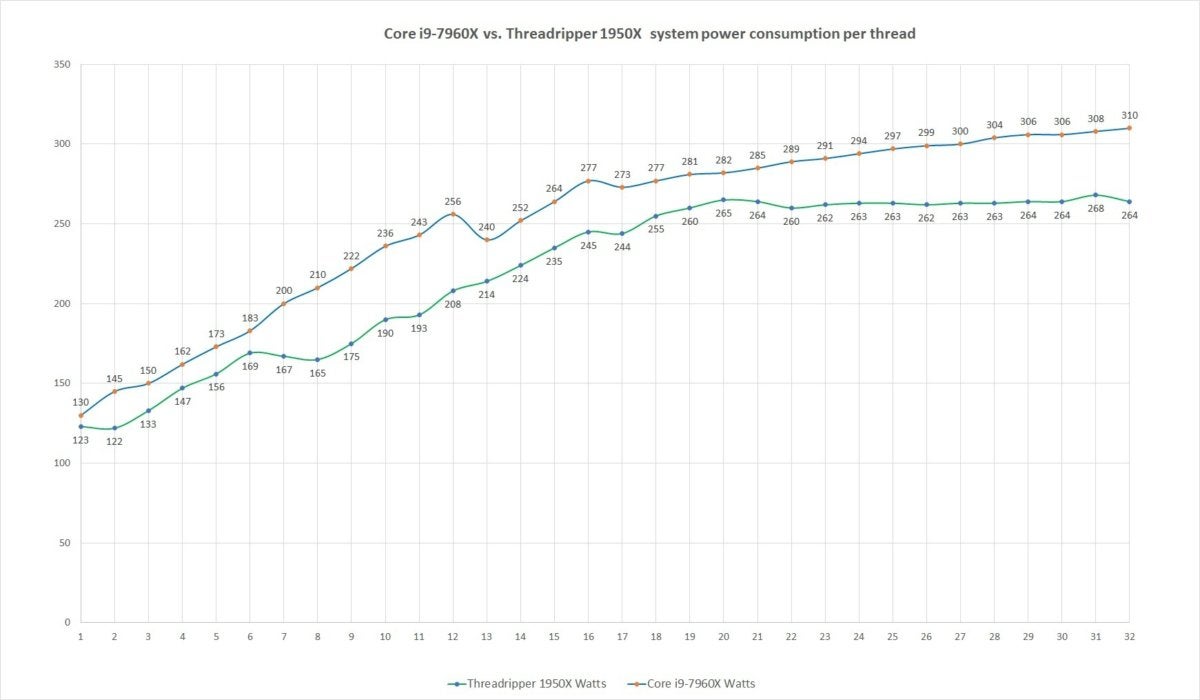
We usually shy away from power consumption comparisons because they can be blown out of proportion. In a desktop PC with multiple drives and a graphics card, the CPU isn’t the power hog, it’s the graphic card. The second reason is the difficulty measuring power consumption between different systems. But hey, here we are with nearly duplicate systems, so we plugged the Northwest Talon PCs into Watts Up Pro meters and measured the total power consumption under different CPU-only loads.
Using Cinebench R15 to push the systems from 1 thread to 32 threads, it was clear which CPU was the winner. What’s also interesting is to see how Threadripper’s power consumption levels off once it hits about a 16-thread load. Core i9 just continues to ramp up power consumption as you increase the load. And mind you—this is stock clocked. Vendors have told us they’ve seen Core i9 consume more than 500 watts under heavy overclocking.
 IDG
IDGYou can see the power consumption of Threadripper level off, while Core i9 just keeps climbing for the stars.
Frequency Scaling
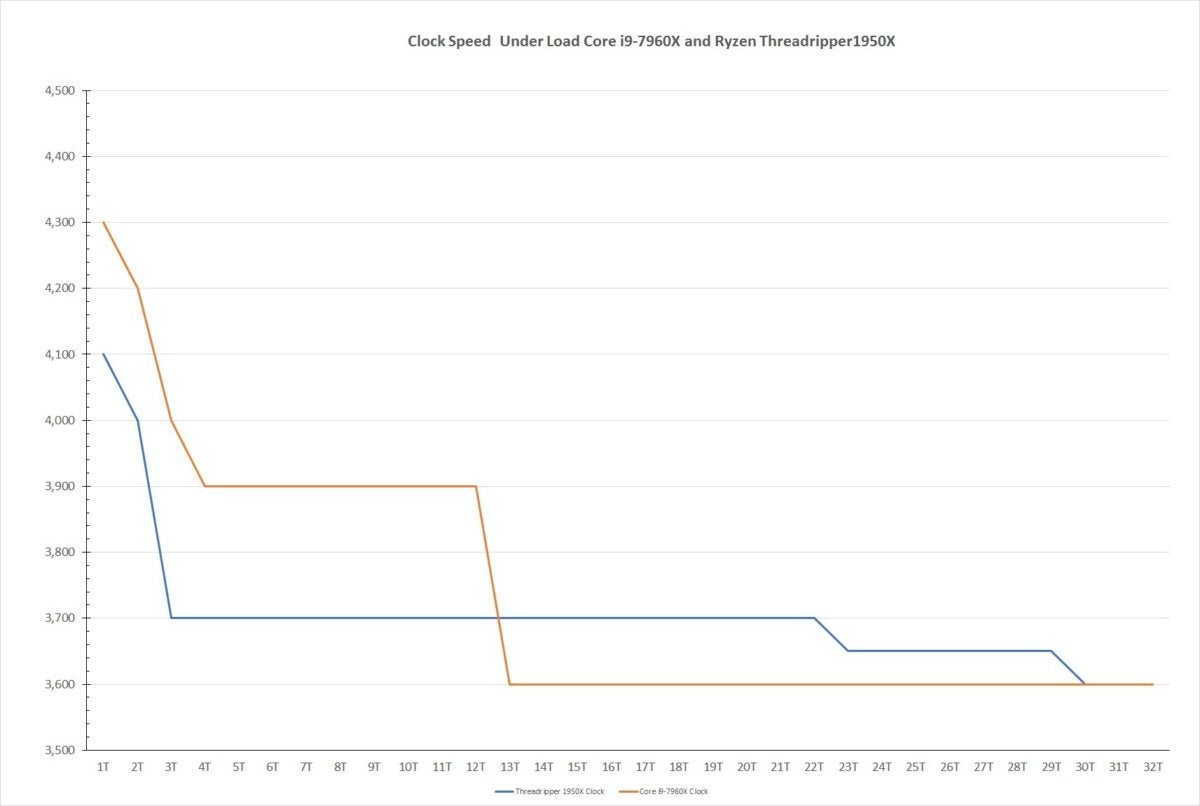
One question many people have asked is just where Core i9 gets all of its performance. For the most part, Core i9 is a modified Skylake core, which means that in Instructions Per Cycle, it’s not that far ahead of the cores in the Threadripper chip. The main difference is likely its clock advantage. We again took Cinebench R15 and varied the workload from 1 thread to 32 threads, recording the clock speeds using the respective Intel or AMD utilities (XTU and Ryzen Master).
The chart below shows the Core i9 with a minimum of 200MHz clock speed advantage on loads up to 13 threads or so. Beyond that, Threadripper actually has the advantage by about 100MHz.
 IDG
IDGYou can see where much of the improvement for Core i9 comes from on the low-end: clock speed.
Thread scaling performance
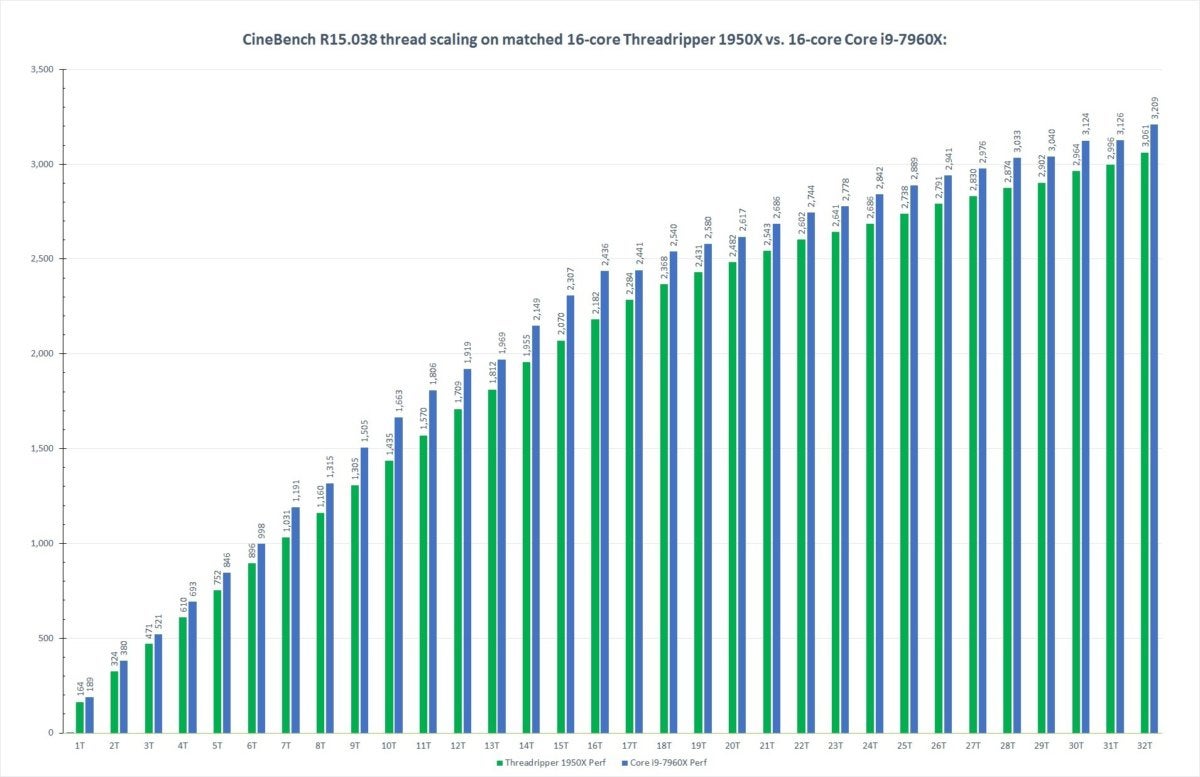
To see how that clock speed advantage plays out, we again use Cinebench R15 to vary the workload from 1T to 32T and record the final score. Core i9 leads the way the entire time.
 IDG
IDGCore i9 has the performance advantage in light loads and also heavy loads.
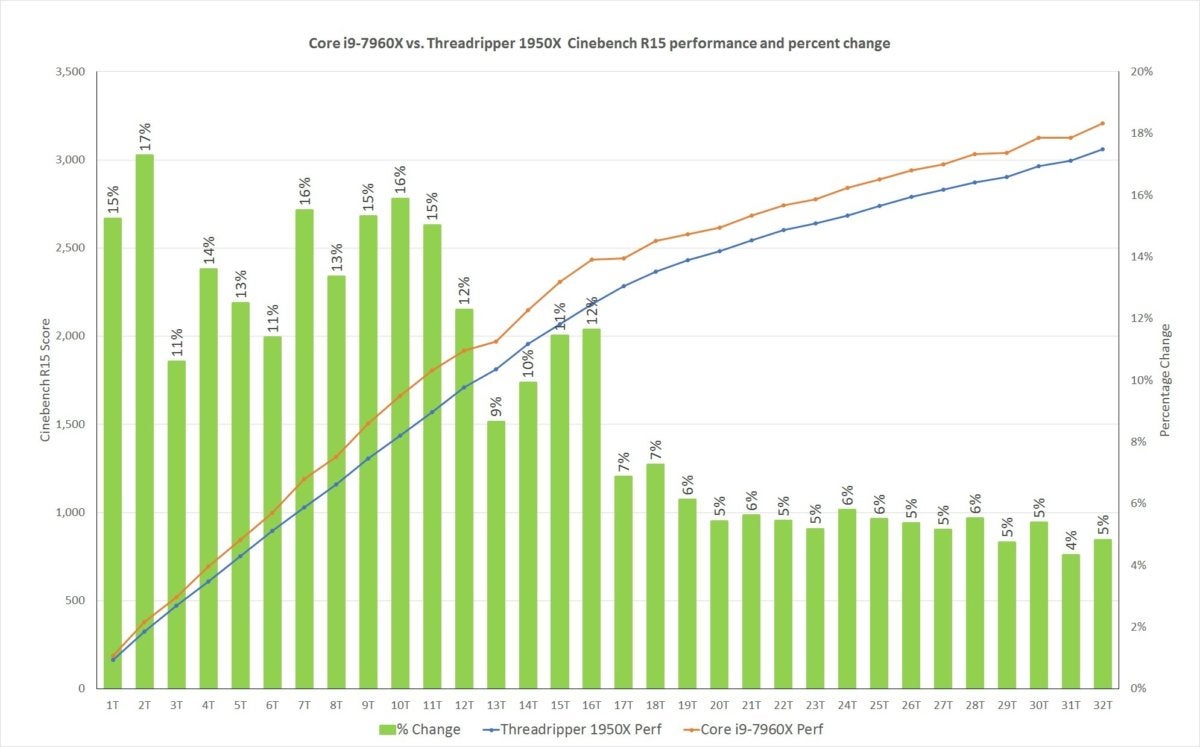
One thing the above chart doesn’t get across is the actual advantage the Core i9 has on lightly threaded tasks, so we calculated the percent difference between the two. The green bars below show the Core i9 has pretty much a double-digit performance advantage on lightly threaded tasks up to about 16 threads.
 IDG
IDGOur Cinebench chart doesn’t quite show the performance advantage the Core i9 has at light loads, but this clearly shows a very healthy double-digit performance at light-duty loads for Core i9, and a five-percent advantage on multi-threaded tasks.
The bang for buck stops here
AMD fans have been biting their tongues this whole time, and here’s why: Our 16-core vs. 16-core contest ignores the key difference between Core i9-7960X and Threadripper 1950X. AMD charges $1,000 for the Threadripper 1950X, while Intel charges $1,700 for the Core i9-7960X. In builder’s terms, that difference is equivalent to a motherboard and a decent SSD.
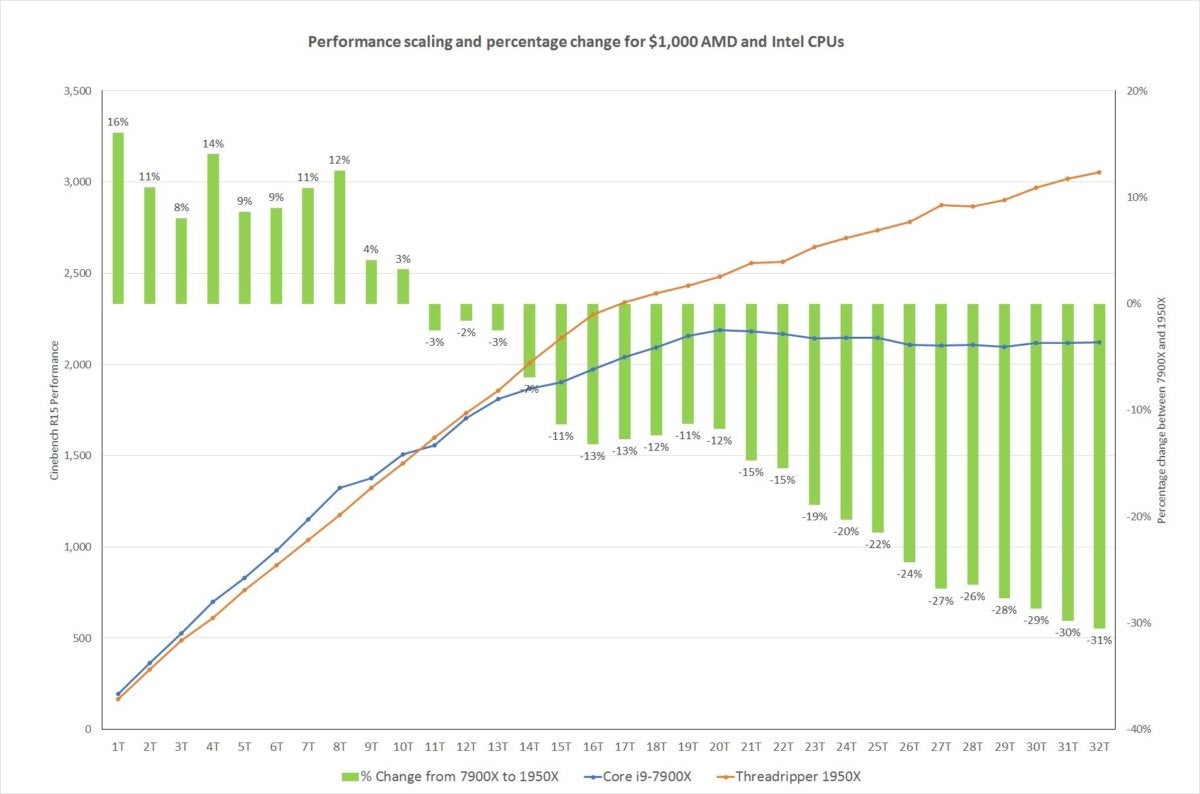
If we had decided to do this contest based on CPU pricing, it really would be the 16-core Threadripper 1950X vs. the 10-core Core i9-7960X. That flips the entire conversation, as you can see in the 16-core vs. 10-core battle we did when we originally reviewed Threadripper 1950X.
The chart below shows the performance advantage the 10-core Core i9-7900X has at the low end, but once you cross over to about 10 threads, Threadripper’s 16 cores takes over and you’re looking at up to a 31-percent performance deficit for that Core i9 chip.
 IDG
IDGThe secret to Threadripper is its cost. You can see where the 16-core Threadripper 1950X rips the 10-core Core i9-7900X to pieces despite being the same price.
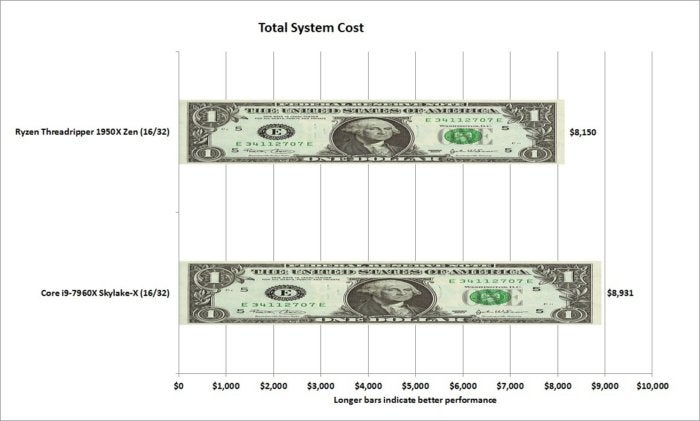
One last thing to consider is that the price of just the CPU isn’t everything. When it’s watered down by the total cost of the system, it may indeed be worth it for some. For example, the Falcon Northwest Talon systems that we used were both dream configurations with $2,400 in GPUs, maybe $1,800 in RAM and $1,200 in SSDs. That doesn’t count the motherboard, hard drive, cooling, case, power supply or custom hand-paint jobs. When you’re building a box in this range, the price difference in the CPU isn’t that much. Of course, not everyone buys loaded machines like the Falcons. If your machine budget is closer to $3,500, then the $700 you save on a Threadripper represents a much larger part of the budget.
 IDG
IDGThe $700 probably seems excessive—unless you’re looking at an uber-expensive box such as either of the Falcon Northwest Talon PCs.
Conclusion
Looked at in a core-vs.-core battle without considering price, Intel’s Core i9-7960X leads the way. It gives you great performance at light-duty applications and generally can’t be touched by the Threadripper 1950X in heavy-duty applications, either. In a lot of the tests we ran, we were actually surprised Core i9 ran away from Threadripper so easily.
That said, it’s pretty hard to ignore price when you’re spending your own money on a build. Our opinion hasn’t changed for Threadripper: It is absolutely the best $1,000 CPU you can get, a spectacular deal. But price aside, in a 16-vs.-16 battle, Core i9 is the winner.


